- On the example of aleno.pl shop
Optimisation
of PLA campaigns
All activities we undertake when working with our clients are focused on the following objectives:
- Development of campaign structure
- Collection of data
- Use of bidding methods based on machine learning
Comparison of results for the first and last month of the campaign
%
Increase in revenue
%
Increase in costs
%
Increase in ROAS
launch
Assumptions
We took over the management of the Google Ads account for Aleno.pl shop less than a year after we started any advertising activities promoting the assortment and brands available in the shop. At the moment of establishing cooperation, PLA campaigns run by the client were generating large losses. Our task was to:
- preparation of an analysis of the existing situation
- preparation of a new action plan
- bringing the campaign to a profitable state as quickly as possible
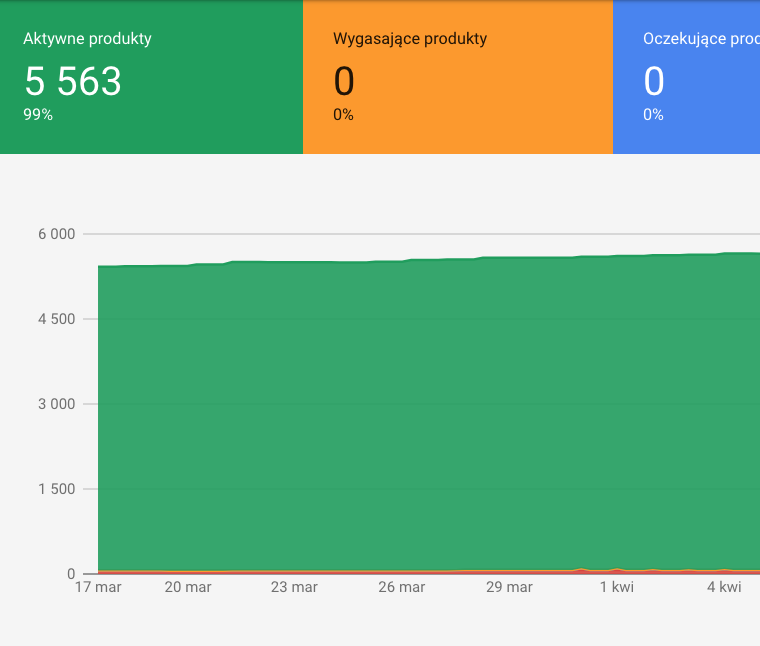
Situation found
All of the client's PLA campaigns were characterised by 3 issues:
- lack of a well thought-out campaign structure to analyse results
- no optimisation strategy
- unreflective use of bidding in the ROAS model
The impact of these errors was compounded by the shop's large assortment and extensive category structure.
Number of producers
Number of categories
Number of products
Plan
Basic optimisation assumption
The basis of a successful PLA campaign is always the thoughtful collection of data and its subsequent analysis. For this reason, all the activities we undertake in cooperation with our clients are focused on the following objectives:
- Development of a campaign structure allowing for effective analysis and optimisation
- Collecting data to estimate realistic sales targets
- Creating a framework for action to make optimal use of machine learning-based bidding methods (e.g. ROAS)
Productfeed
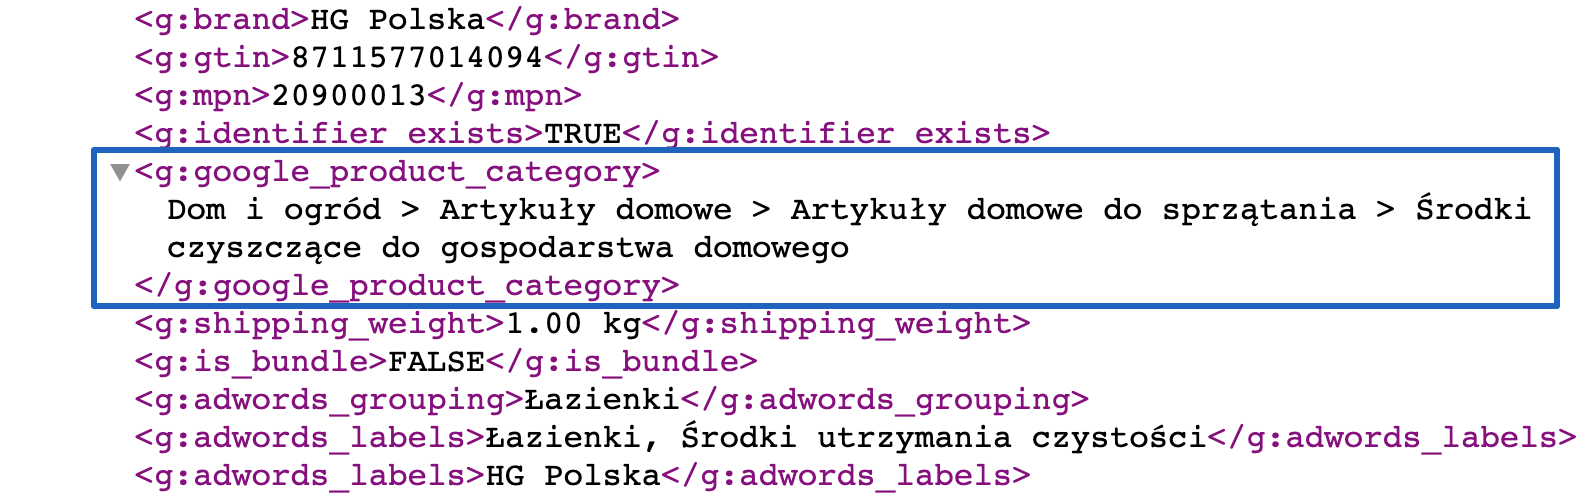
PLA campaigns unfortunately give us limited targeting and ad creation options. All the most important variables are taken automatically from the Google Merchant Center product feed. Therefore, it is important to prepare it properly:
- Adding complete product names
- Listing all key product features in the descriptions, preferably in bullet form
- Precise and detailed selection of Google product categories
Campaign optimisationstages
During the optimisation process, we tested three account structure ideas. Each of them emphasised a different way of allocating the assortment and enforced a different strategy for optimising conversion costs:
- Create, by means of exclusions and appropriate prioritisation, a division into brand campaigns for specific manufacturers and a collective generic campaign.
- Division of campaigns into categories reflecting the structure of the shop including a division into branded and generic campaigns.
- Abandoning the producer campaign and brand division in favour of two general campaigns:
- Priority campaign bid in ROAS model
- The entire range on a low priority at a very low CPC.
Stage 1
Basic assumption
Campaigns created using exclusions and appropriate prioritisation. Split between branded campaigns of specific manufacturers and a collective generic campaign.
Bidding model: CPC. Ultimately changed to ROAS.
Pros:
- High control over best converting (branded) queries
- Ease of analysis of the sales potential of individual brands
Disadvantages:
- Very labour-intensive process of selecting appropriate exclusions (very large range and long specialised model designations)
- Campaigns do not reflect the structure of the shop and the interest in individual categories.
Challenges
PLA campaigns unfortunately give us limited targeting and ad creation options. All the most important variables are taken automatically from the Google Merchant Center product feed. Therefore, it is important to prepare it properly:
- Adding complete product names
- Listing all key product features in the descriptions, preferably in bullet form
- Precise and detailed selection of Google product categories
Results of stage 1:
%
Increase in revenue
%
Increase in costs
%
ROAS
Stage 2
Basic assumption
Division of campaigns into categories reflecting the structure of the shop including a division into branded and generic campaigns.
Bidding model: Aggressive, hand-set CPC in top branded campaigns and ROAS in other campaigns.
Pros:
- Ability to bid and assess profitability in terms of category seasonality
- Good overview of manufacturers' performance in the category area
Disadvantages:
- High data fragmentation reducing the potential for algorithmic campaign optimisation
Results of stage 2:
%
Increase in revenue
%
Increase in costs
%
ROAS
Stage 3
Basic assumption
Limit to two campaigns reflecting shop categories at the product group level.
Bidding model: Priority campaign bid on ROAS model and all low priority product range on very low CPC.
Pros:
- Creating the huge pool of data needed for algorithmic bidding
- The ability to exclude lower performing categories from the main campaign yields large increases in profitability
- Low CPC campaigns allow analysis of seasonal changes and market trends with limited risk
Disadvantages:
- Loss of some control over rate optimisation within categories
- Abandonment of branded campaign optimisation
The main objective of the third phase was to further scale revenues. The result was a large increase in costs, which fortunately also translated into a large increase in revenue.
Results of stage 3:
%
Increase in revenue
%
Increase in costs
%
ROAS
Results
Significant increase in revenue

Stable ROAS
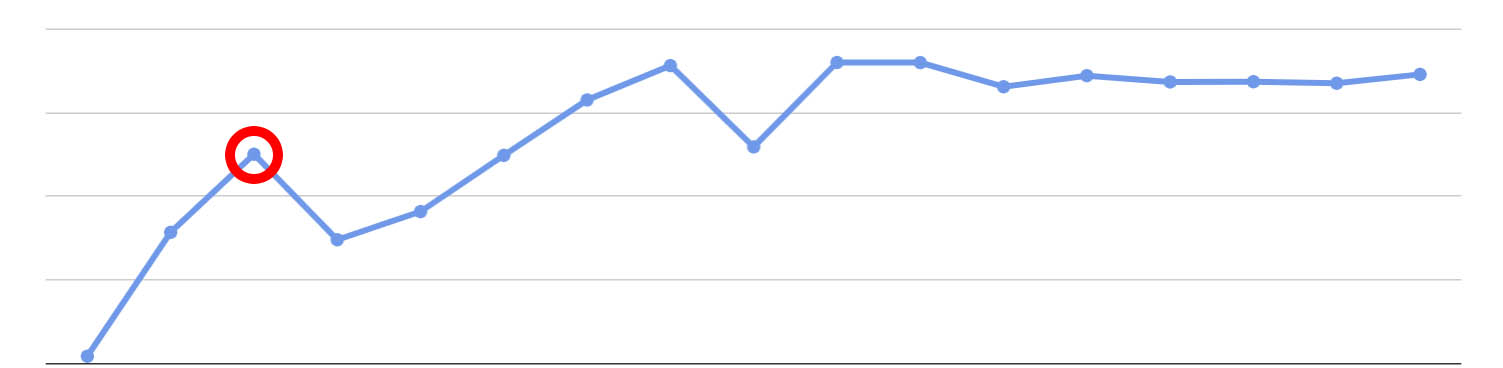
Comparison of results for the first and last month of the campaign
%
Increase in revenue
%
Increase in costs
%